

- Purpose and Benefits of an Org Chart
- Comparing Common Organizational Chart Structures
- Best Practices for Creating and Maintaining Your Org Chart
- Pitfalls to Avoid with Organizational Charts
- Industry Applications of Organizational Charts
- A Simple Implementation Plan for Your Org Chart
- Future Outlook and Trends for Organizational Charts


Organizational Charts: A Guide for Modern Businesses
An organizational chart is a visual map of a company's structure. It shows the reporting relationships and hierarchy from top to bottom. Think of it as a blueprint for who reports to whom and how departments connect.
This simple tool provides clarity on roles, responsibilities, and the chain of command. It helps both employees and leaders understand the company's framework. For example, it clarifies who to approach for certain decisions and where each person fits in the bigger picture. In today's fast-paced business world, a clear structure is more important than ever.
An org chart supports efficient operations and fosters transparency. It is a cornerstone of effective organizational planning and development. This document helps new hires understand the company's layout and helps long-term employees see career paths and promotion opportunities within their team and beyond.
Purpose and Benefits of an Org Chart
The main purpose of an org chart is to create a shared understanding of a company's structure. This is key for internal communication and making decisions. It helps manage talent and plan for the future. An up-to-date chart is a crucial part of human resources management. It provides a quick way to find key contacts and understand what each department does. When a business is growing, an org chart helps identify gaps and plan for future hiring needs.
It can be a valuable tool for leaders who want to streamline processes and improve teamwork. As your team grows, keeping a clear view of your company's structure is a must for staying efficient.
Key Points About Organizational Charts
Org charts are essential for clarity and operational efficiency. They are not just for large corporations; any business can benefit from having a clear visual of its structure. Here are some of the main takeaways.
Clarity on Roles and Responsibilities:
An org chart clearly shows what each person does. It removes confusion about job functions and reporting lines. This is vital for reducing conflicts and improving accountability within teams.
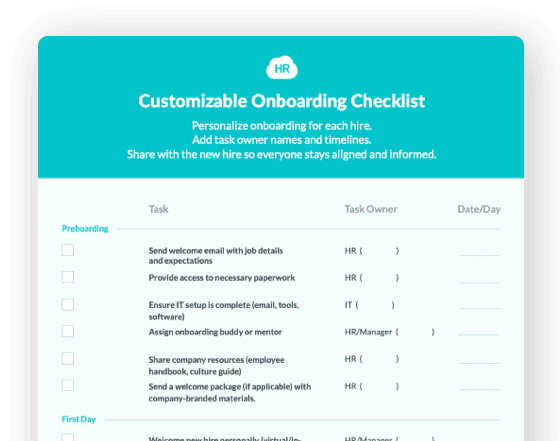
Aids in Onboarding and Training:
New employees can quickly learn the company structure. This helps them navigate the workplace and understand who to contact for support. An effective onboarding process is essential for new hire success. For example, using specialized onboarding software can make this process even smoother.
Supports Strategic Planning:
Leaders can use the chart to identify strengths and weaknesses in their structure. This helps them plan for growth, reorganization, or even a downsizing process. It is a key tool for workforce planning.
Improves Communication Channels:
By visualizing reporting lines, an org chart shows the formal communication pathways. This makes sure information flows correctly and efficiently through the organization. A company intranet is a great way to improve internal communication.
Visualizes Career Paths:
Employees can use the chart to see potential paths for career progression. This is a powerful tool for employee engagement and retention. It shows a commitment to developing talent from within.
Comparing Common Organizational Chart Structures
Different business models need different types of organizational charts. Choosing the right one depends on your company’s size, industry, and goals. Here is a comparison of three popular structures.
|
Structure Type |
Best For |
Key Advantages |
Potential Disadvantages |
|
Hierarchical |
Traditional companies with clear chains of command. |
Clear authority, defined roles, and easy to understand. |
Slow decision-making, less flexibility, and can create silos. |
|
Matrix |
Project-based organizations, like tech or engineering firms. |
Enhances collaboration, flexibility, and resource sharing. |
Complex reporting lines, potential for conflict, and requires strong leadership. |
|
Flat |
Small businesses and startups that need agility. |
Fast decision-making, high employee autonomy, and better communication. |
Potential for confusion over roles and can be hard to scale. |
Best Practices for Creating and Maintaining Your Org Chart
To get the most out of your organizational chart, it needs to be accurate and useful. Here are some helpful tips for business decision-makers.
Keep It Simple and Up-to-Date:
An org chart is only as good as its accuracy. Update it regularly as people join, leave, or change roles. Use simple, clear language and job titles. Avoid jargon. A clean and current chart is much more effective. Staying on top of this process is a key part of human resource information systems.
Use the Right Tool:
Do not use a static image or a spreadsheet. Use a dedicated software solution that allows for real-time updates and easy sharing. Many modern HR platforms include this feature.
Involve Your Team:
Do not make the chart in a vacuum. Ask department heads to review their teams. This makes sure it is accurate and gives them a sense of ownership. A collaborative approach leads to a more precise and useful chart for everyone.
Make It Accessible:
The chart should be easy for all employees to find and view. Post it on your company's intranet or in your HR portal. Accessibility ensures everyone can benefit from the clarity it provides.
Add Additional Details:
Beyond just names and titles, consider adding photos, contact information, and even a short bio. These small additions personalize the chart and make it more useful for networking and communication. This kind of detail can enhance a complete employee directory.
Pitfalls to Avoid with Organizational Charts
Even with the best intentions, it is easy to make mistakes when using org charts. Avoiding these common errors will ensure your chart remains a powerful business tool.
Outdated Information:
This is the most common mistake. An old chart is worse than no chart at all because it gives misleading information. Make it a routine task to update the chart.
Making It Too Complex:
Do not try to include every single detail. Overloading the chart with too much information makes it hard to read and understand. Keep it clean and focused on essential information.
Ignoring Informal Structures:
The org chart shows the formal hierarchy, but every company has informal networks. While you do not chart these, it is important to remember they exist and influence how work gets done. According to a Harvard Business Review article, managers can use network maps to understand these informal structures.
Using It as a Power Play:
The chart should be a tool for clarity and efficiency, not a way to show who has more power. Using it to create divisions or reinforce a rigid hierarchy can harm company culture. A healthy workplace culture is built on collaboration.
Not Communicating Changes:
When you update the chart, tell people. A simple email or company-wide announcement can ensure everyone is working with the latest information.
Industry Applications of Organizational Charts
Organizational charts are used in all sectors, from technology to healthcare to manufacturing. They help different industries address their unique challenges.
Technology Companies:
In a fast-moving tech company, org charts help manage project teams and matrix structures. For example, a software engineer might report to a functional manager but also work on a project for a separate project manager. The chart helps manage these dual reporting lines. This is key for companies focused on creating new technology.
Healthcare:
A hospital's org chart is vital for managing patient care and operations. It clearly shows the hierarchy from department heads to nurses and support staff. This clarity is essential for a high-stakes environment where clear communication is non-negotiable. It ensures everyone knows their role during an emergency or daily operations. It is an integral part of their human resources management.
Manufacturing:
In a factory, the org chart lays out the chain of command on the production floor. It shows who reports to the shift supervisor, who reports to the floor manager, and so on. This structure ensures safety protocols are followed and production goals are met. It also provides a clear path for reporting issues and getting support.
A Simple Implementation Plan for Your Org Chart
Creating a useful organizational chart is a structured process. Here is a step-by-step guide to get started.
Gather the Data:
Start by collecting all the necessary information. This includes current employee names, job titles, and reporting relationships. Talk to department leaders to get accurate data.
Choose a Structure:
Decide on the type of chart that best suits your business—hierarchical, matrix, or flat. Your choice will depend on your company's size, culture, and goals.
Select a Tool:
Choose a software solution that makes the process easy. Many HRIS platforms offer built-in org chart features that can automate updates.
Draft the Chart:
Begin building your chart based on the data you collected. Start with the top leadership and work your way down, adding departments and individual employees.
Review and Refine:
Share the draft with department heads and key stakeholders. Ask for their feedback and make any necessary corrections. An external review can often catch errors you missed.
Publish and Communicate:
Once the chart is final, make it accessible to everyone in the company. Announce its availability and explain how it can be used to improve communication and clarity. A good announcement helps get the team on board.
Maintain It:
Establish a routine to update the chart regularly. This could be a quarterly review or whenever a new hire starts. Staying current is key. This routine maintenance is an essential part of an efficient workflow for human resources.
Future Outlook and Trends for Organizational Charts
The future of the organizational chart is dynamic. As companies become more global and project-based, the old static chart is evolving. Here is what is on the horizon.
Dynamic, Real-Time Charts:
The traditional, static org chart is becoming obsolete. The new standard is a live, dynamic chart that updates automatically as roles change. This is supported by modern HR software that integrates with employee databases. This real-time view is more accurate and useful.
Focus on Skills and Networks:
Future charts may not just show hierarchy. They will also map out skills, project involvement, and informal networks. This provides a richer picture of how a company really operates. According to a Harvard Business Review article, understanding these informal networks is just as important as the formal structure.
AI and Analytics:
Artificial intelligence will play a bigger role in analyzing org charts to reveal hidden insights. For example, AI could identify who is overburdened or where there are communication bottlenecks. This data-driven approach to org design is the next frontier. The World Economic Forum has highlighted the importance of using technology to better manage the future of work.
More Fluid and Agile Structures:
As businesses move toward more agile and flexible models, their charts will reflect this. They will show project teams and temporary roles, not just permanent positions. This adaptability is key for businesses to stay competitive.
Keep Reading
Best 10 HR Analytics Tools in 2026
Organizations running on hard evidence see a steep drop in daily friction and employee
Time Tracking Compliance for Hourly and Deskless Workers: The 2026 Guide
If you manage hourly employees across more than one location, you're carrying legal
The Hidden Cost of a Fragmented HR Stack: When 5 Tools Cost More Than 1 Platform
If you're an HR Director justifying next year's software budget, the number on your
Ready to streamline your onboarding process?
Book a demo today and see how HR Cloud can help you create an exceptional experience for your new employees.