
A good employee turnover rate is generally 10% or below annually, but industry context matters far more than any single benchmark. According to U.S. Bureau of Labor Statistics JOLTS data from January 2026, monthly separation rates range from 1.2% in government to 5.4% in leisure and hospitality. The most actionable definition: a rate below your industry average, trending downward, and concentrated in roles where exits cause the least operational damage.

Table of Contents:

- What Is Employee Turnover, and How Do You Calculate It?
- What Is a Good Turnover Rate in 2026?
- Turnover Rate Benchmarks by Industry
- What High Turnover Is Actually Costing You
- Your 90-Day Retention Action Plan
- 6 Strategies That Actually Move Your Turnover Number
- How HR Cloud Helps
- Calculate What Turnover Is Costing Your Organization
What is a good turnover rate, and how do you know if yours is actually a problem?
A good employee turnover rate is one that sits below your industry average and trends downward over time — the commonly cited 10% annual benchmark only applies when you have no better comparison available.
Why does the industry breakdown matter so much?
A 30% rate in manufacturing hits completely differently than 30% in hospitality, especially when the exits are coming from your most experienced skilled trades workers.
How can HR leaders get ahead of this?
This guide uses January 2026 BLS data to give you real benchmarks by industry, a framework for reading your own number honestly, and a 90-day plan for actually moving it.
Three nurses resigned last month. Two warehouse supervisors the month before. Your CFO just asked what's going on with headcount costs. And somewhere in your spreadsheet is a turnover number you're not sure how to defend.
That question — "is our turnover rate good?" — sounds simple. It isn't. The honest answer depends on your industry, which roles are leaving, and whether your rate is moving in the right direction. Most benchmark articles give you a single target, a wall of generic advice, and data that's already a year old.
This one uses the latest available U.S. Bureau of Labor Statistics separation rates by industry from January 2026, a clear framework for reading your number, the specific actions that move it, and a 90-day plan you can start Monday.
What Is Employee Turnover, and How Do You Calculate It?
Employee turnover is the rate at which people leave your organization and need to be replaced. The formula:
(Number of Separations ÷ Average Number of Employees) × 100 = Turnover Rate %
If 18 employees left a company that averaged 200 people over the year, that's 9% annual turnover. For your average headcount, add your beginning and ending count for the period and divide by two.
Run this monthly, not just annually. Monthly data catches where exits are clustering — which department, which tenure band, which season. Annualized numbers smooth over the spikes that tell you something is actually wrong.
Voluntary vs. Involuntary: The Number That Actually Matters
Your total turnover figure is a starting point. The breakdown is where the insight lives.
Voluntary turnover — resignations, retirements, employees who chose to leave — is what you can actually influence. According to Work Institute's 2025 Retention Report, which analyzed over 120,000 exit interviews, a significant portion of voluntary departures are considered preventable. If this number is high, something in the employee experience isn't working.
Involuntary turnover — terminations, layoffs, performance exits — tells a different story. The BLS JOLTS data for January 2026shows the national layoffs and discharges rate at approximately 1.0% monthly. If yours runs significantly higher than that, the hiring process may be the real issue.
When you work to reduce employee turnover, voluntary exits are almost always the target.
What Is a Good Turnover Rate in 2026?
A commonly cited general benchmark is around 10% annually, but industry context matters far more. That reflects a balance between natural workforce movement — retirements, relocations, genuine career changes — and the operational disruption that comes from replacing people constantly.
But 10% is a cross-industry average used when you don't have better information. If you're in hospitality, 10% would represent a retention result that almost no organization in that sector achieves. If you're in government, 10% would signal a serious problem.
A more useful definition: a good turnover rate is one that is lower than your industry average, trending down year over year, and concentrated in roles where exits are least damaging. That third piece is where most organizations miss. A 15% annual rate driven primarily by entry-level positions you can backfill in two weeks is not the same problem as a 15% rate concentrated in your senior clinical staff or experienced production leads.
Turnover Rate Benchmarks by Industry
The table below comes directly from the U.S. Bureau of Labor Statistics JOLTS report released March 13, 2026, covering January 2026 preliminary data. These are monthly total separation rates. The "So What" column is where to focus.
|
Industry |
Monthly Rate |
~Annual (Approx.) |
So What |
|
Leisure & Hospitality |
5.4% |
~65% |
Industry-structural. Competing on total rate is the wrong goal — protect managers and shift leads instead. |
|
Accommodation & Food Services |
5.2% |
~62% |
Highest churn in the economy. The real game is retaining the people your competitors can't keep. |
|
Professional & Business Services |
4.6% |
~55% |
High-mobility market. Career path clarity and pay transparency are non-negotiable at this rate. |
|
Construction |
3.6% |
~43% |
Seasonal spikes distort annual figures. Track skilled trades exits separately from general labor. |
|
Retail Trade |
3.5% |
~42% |
Part-time workforce inflates this. Full-time and management turnover are the numbers to watch. |
|
Trade, Transportation & Utilities |
3.1% |
~37% |
Near the national average. Driver and warehouse retention are the priority roles. |
|
Health Care & Social Assistance |
2.6% |
~31% |
BLS average significantly understates clinical role turnover — see section below. |
|
Manufacturing |
2.5% |
~30% |
Skilled trades losses hit hardest. A 30% rate with 20% of exits from machinists is an operational crisis. |
|
Financial Activities |
2.1% |
~25% |
Relatively stable. Rates above this warrant a management effectiveness audit. |
|
Government (all) |
1.2% |
~14% |
Lowest in the economy. Strong benefits and job security drive stability here. |
Source: U.S. Bureau of Labor Statistics, Job Openings and Labor Turnover Survey (JOLTS), January 2026 preliminary data, released March 13, 2026.
Healthcare: Why 31% Annualized Understates the Real Problem
The BLS figure of 2.6% monthly for health care blends dietary aides, housekeeping, and ICU nurses into a single number — and that blending makes it nearly useless for clinical HR planning.
The NSI National Health Care Retention & RN Staffing Report puts registered nurse turnover at 16.4% in its most recent data. Some nursing home and long-term care facilities see facility-level turnover exceed 80%. That's not a rounding error — it's a staffing model that's constantly rebuilding itself.
The right question for healthcare HR leaders isn't "what's our overall rate?" It's: what's our RN turnover, our CNA turnover, our management turnover — and what does each exit cost us? Replacing a bedside RN, factoring in agency coverage, recruitment, credential verification, and ramp-up, routinely runs above $50,000 according to NSI's per-specialty cost analysis. The urgency is different at that price.
Organizations making real progress at healthcare employee retention track credential-bearing clinical staff separately from support roles. They have different problems and require completely different fixes.
Hospitality and Retail: Reframe the Goal
Accommodation and food services at 5.2% monthly — roughly 62% annualized — is not evidence the industry is broken. It reflects the structural reality of seasonal demand, part-time scheduling, and limited advancement for front-line roles.
Chasing a 10% annual rate in full-service restaurants is like trying to make it not rain. The productive goal is different: are we below our direct competitors? Are we keeping our managers and shift leads? Are we losing high performers or the people who weren't working out anyway?
Organizations gaining ground in these sectors protect the roles that cost the most to replace, build real advancement tracks that give ambitious employees a reason to stay, and run recognition programs that make people feel seen in jobs that can feel invisible.
Manufacturing and Construction: When the Rate Hides the Real Story
Manufacturing at 2.5% monthly (roughly 30% annualized) and construction at 3.6% (roughly 43%) both look manageable until you ask who is leaving.
A 30% rate where most exits are new hires who didn't clear 60 days is survivable. The same rate with 25% of departures coming from CNC machinists, welders, or quality technicians with four or five years of experience is a threat to production capacity. Those skills take 18 to 36 months to develop. You don't backfill them fast.
Track turnover by role category, not just headcount. The aggregate number will tell you something is wrong long after the damage has started.
What High Turnover Is Actually Costing You
Most organizations underestimate this because they only count what's visible: job postings, recruiter time, onboarding hours. Those are the easy costs.
Work Institute's 2023 Retention Report puts replacement cost at a conservative 33% of the departing employee's annual salary. Gallup's research extends the range to 0.5 to 2 times annual salary depending on role complexity. For a $65,000 employee, that's $32,500 on the low end — or $130,000 if the role is specialized and the ramp-up is long.
Run that across your actual exit volume and the number becomes hard to ignore. If you lost 40 employees last year at an average salary of $55,000, you're looking at somewhere between $726,000 and $4.4 million in turnover costs — depending on those roles and how long it takes to fill them. Most finance teams are not tracking this. Most HR teams aren't surfacing it either.
Use HR Cloud's free Employee Turnover Calculator to see your real number →
The Costs Nobody Puts in the Spreadsheet
Productivity redistribution. When someone leaves, their work doesn't disappear — it moves to the people who stayed. Those people are already doing their own jobs. The added load produces two outcomes: slower output, and eventually another resignation from someone who burned out carrying a departed colleague's workload.
Institutional knowledge loss. The undocumented process. The relationship with the difficult client. The four years of context behind why a decision was made a certain way. None of that appears in an offboarding checklist. It walks out the door and spends the next three months helping your competitor.
Contagion. When a respected employee leaves — especially a manager or informal team leader — it triggers reassessment among people who weren't thinking about leaving. One visible departure can quietly start three more. This is the turnover cost that compounds.
Patient and customer experience. In healthcare, staffing gaps have direct patient care implications. In professional services, client relationships are personal. In retail, service quality drops when the experienced people are being replaced continuously by new hires still learning the job.
Your 90-Day Retention Action Plan
The gap between recognizing a turnover problem and acting on it is where most organizations stall. This plan is a starting point, not a complete program — but it's enough to stop the bleeding while you build something more structural.
Days 1–30: Diagnose before you prescribe. Pull your voluntary turnover rate for the past 12 months, broken down by department, role, and tenure band. Find where exits are actually clustering. Run exit interviews on recent departures with the genuine intent of identifying repeating themes — not performing them. If you haven't been doing exit interviews, launch a pulse survey to establish a sentiment baseline before you start trying to fix things.
Days 31–60: Address the most concentrated problem. For most organizations, the data will point to one of two places: early-tenure exits in the first six months (an onboarding problem) or mid-tenure exits from people with two to five years in the role (usually a management or career development problem). You can't fix everything at once. Pick the bucket with the most exits and make one structural change there.
Days 61–90: Build the tracking system that keeps this visible. Define how you'll measure turnover going forward — monthly voluntary rate, by department, by role category — and establish a recurring review cadence. Turnover that gets tracked monthly gets addressed. Turnover reviewed once a year in an annual report becomes a crisis that surprises everyone who wasn't paying attention.
6 Strategies That Actually Move Your Turnover Number
Generic retention advice has been around for decades. The problem isn't that HR directors don't know what to do — it's that implementation gets vague fast. Here's what specific interventions look like in practice.
1. Fix Onboarding Before You Fix Anything Else
If those three nurses who resigned last month all joined within the past year, this is your section. According to Work Institute's Retention Report, sixty-one percent of departures happen within the first 12 months. Fifty-four percent leave before month six. If that's where your exits are clustering, you don't have a retention problem — you have an onboarding problem.
Structured 90-day programs with clear milestone check-ins, assigned peer buddies, and documented expectations consistently reduce early-tenure exits. The operational challenge is consistency: most organizations deliver a solid onboarding experience when the right manager is paying attention and a mediocre one when they're not.
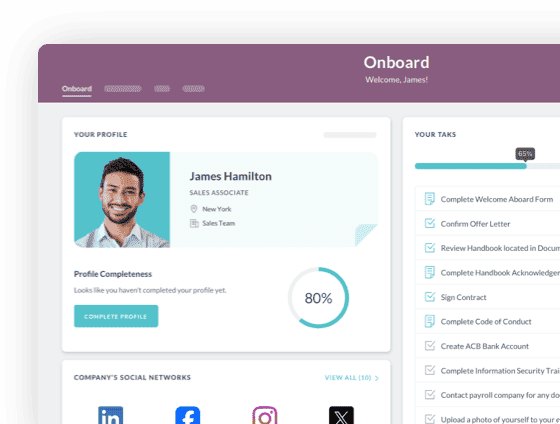
Employee onboarding software solves the consistency problem. Every person gets the same structured start regardless of department or location. No hire falls through the cracks because their manager was traveling in week two.
Veolia North America, with over 10,000 employees across field-based operations, faced exactly this problem before implementing HR Cloud. Many field workers had limited email access and no reliable way to complete onboarding paperwork in the field. After moving to a mobile-first automated onboarding process, Veolia achieved a 75%+ mobile onboarding completion rate and their HR team gave the impact a 10/10 score. Meghan Caskey, HR Coordinator at Veolia, described the platform as integral to their operations and praised how the support materials helped adoption even among employees who don't hire frequently.
2. The Manager Problem Is Not Going Away on Its Own
According to Gallup's workplace research,a large share of the reasons for voluntary turnover can be influenced by managers — meaning the single most effective retention investment in most organizations is not a benefits package or a perks program, it's developing managers who actually know how to manage people.
What that looks like in practice: weekly or biweekly one-on-ones that happen consistently (not just before performance reviews), specific and timely feedback rather than vague annual ratings, and the ability to recognize good work in the moment rather than waiting for a formal process to require it. These are learnable skills. They require deliberate development, not a half-day training once a year.
Organizations that track manager-specific turnover rates — exits attributable to specific manager behavior rather than aggregate team turnover — can identify and address problems before they become patterns.
3. Recognition Has to Be Consistent, Not Just Periodic
Research by Bersin by Deloitte found that organizations with strong recognition programs see 31% lower voluntary turnover. That's not because recognition is a magic solution — it's because consistent recognition signals to employees that the organization sees them, which is the prerequisite for engagement.
The failure mode here is sporadic recognition that depends entirely on whether a particular manager happens to be expressive. One team gets regular acknowledgment; another goes months without hearing anything positive. Both teams notice.
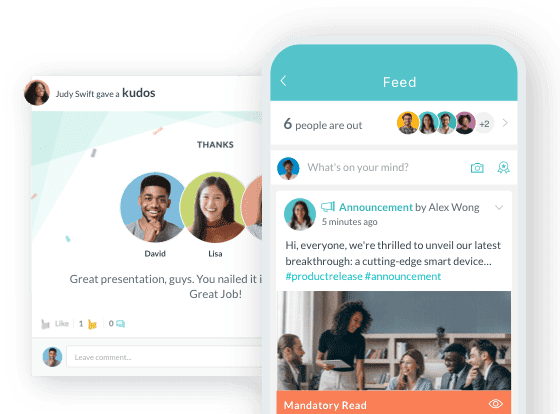
Workmates makes peer-to-peer recognition visible across the whole organization — not just manager-to-employee — and gives frontline workers in distributed settings the same experience as people sitting near leadership. For healthcare and manufacturing environments where people are physically separated from corporate, that visibility matters more than most executives realize.
Interim HealthCare SLC, a home health franchise operating across multiple states, used HR Cloud's engagement platform alongside structured onboarding to give their field clinical staff a connected experience from day one. Michael Hawkins, the franchise owner, described being able to deploy new hires to patient care immediately after onboarding with full confidence in their compliance readiness.
4. Career Paths Need to Be Written Down
According to iHire's 2024 Talent Retention Report, 56.3% of employees cited clear paths to advancement as a key factor in staying with an employer — making career development one of the most actionable retention levers available. That's not about salary. It's about whether someone can see a version of their future inside your organization.
Most managers believe they've communicated career paths when they've actually gestured in the direction of one. "You're doing great, there will be opportunities" is not a career path. A career path tells someone: here is the next role, here is what it pays, here are three or four things you need to demonstrate to get there, and here is a realistic timeline. Write it down. Have the conversation. Document the development plan. People who can see a specific future somewhere tend to stay and find out if they're right.
5. Pulse Surveys Only Work If You Act on Them
By the time an employee hands in their notice, the decision was usually made four to eight weeks earlier. The period before that decision is your intervention window — and most organizations have no visibility into it because they run annual engagement surveys and treat the results as informational.
Pulse surveys — short, frequent, targeted check-ins — surface discontent while there's still time to respond. But they only work if people believe something changes. Teams that complete surveys and see no action become more cynical than they would have been if you'd never asked. The minimum viable response: share back what you heard and name one concrete thing you're doing about it.
6. Compensation Has to Clear the Threshold
According to iHire's 2024 Talent Retention Report, unsatisfactory pay ranked sixth at 20.5% among reasons employees voluntarily left — behind toxic work environment (32.4%), poor company leadership (30.3%), manager dissatisfaction (27.7%), and poor work-life balance (20.8%). People don't leave primarily because of pay; they leave for other reasons and then discover they can earn significantly more elsewhere.
Compensation that's below market doesn't cause departures directly — it removes any reason to reconsider once the decision is already made. Review your ranges against market data annually. Be transparent about how pay decisions are made. The perception of unfairness is often more damaging than the actual gap.
How HR Cloud Helps
If you're looking at the strategies above and wondering where to start practically, here's how to think about the tools.
The organizations with the worst turnover problems tend to have the same structural gap: the people most at risk of leaving — field workers, frontline staff, new hires in their first 90 days — are the ones least connected to the things that make people stay. No consistent onboarding. No visibility from leadership. No recognition system that reaches them where they actually work.
Workmates is built specifically for that gap. It gives field employees, nurses on night shifts, warehouse staff, and remote workers access to the same recognition, communication, and engagement tools that office-based teams take for granted. Pulse surveys, peer recognition, mobile access, manager shoutouts — all on a phone, not a desktop. For distributed teams in healthcare, manufacturing, and retail where turnover is highest, this matters in a way that a company intranet visible only on a work laptop simply doesn't.
HR Cloud's onboarding software handles the structured first 90 days that prevent early-tenure exits. The workflows trigger automatically, compliance forms get completed before day one, and managers get visibility into who finished what without manually tracking it. Veolia uses it across 10,000+ field employees with limited email access. Interim HealthCare uses it to get clinical staff into the field faster while maintaining full compliance confidence.
The analytics layer shows you turnover rates by department and role over time — the data you need to make the retention investment conversation before your CFO makes it for you.
None of this requires you to replace your payroll system or rebuild your HR stack. HR Cloud integrates with ADP, Workday, UKG, Paylocity, and other platforms your team already uses.
Calculate What Turnover Is Costing Your Organization
Your CFO doesn't need a benchmark report. They need a number: how much did we spend on turnover last year, and how much would we save if we cut it by 20%?
That calculation — run against your actual headcount, your actual salary mix, your actual exit volume — is what moves retention from an HR priority to a funded business initiative. It's also the number that makes every strategy in this guide defensible in a budget meeting.

Now put a number on it. Most finance teams aren't tracking what turnover actually costs. Get the real dollar figure in two minutes.
- Annual cost of turnover at your headcount
- The hidden costs your P&L isn't capturing
- ROI projection ready for your next budget meeting
Calculate Your Turnover Cost 2,847 HR downloads
Frequently Asked Questions
What is a good employee turnover rate?
A good annual employee turnover rate is generally 10% or below. That threshold reflects natural workforce movement without the disruption and replacement costs that come from constant exits. The more useful benchmark is your own industry average: healthcare averages roughly 31% annually, hospitality can run above 65%. If your rate sits below your industry peer group and is trending downward, that's the real definition of good.
How do I calculate my employee turnover rate?
Divide your total separations in a period by your average headcount, then multiply by 100. If 15 employees left a workforce that averaged 150 employees, your turnover rate is 10%. Calculate average headcount by adding your beginning and ending count for the period and dividing by two. Run this monthly — annual figures mask the seasonal and departmental patterns that tell you where the actual problem is.
What industries have the highest employee turnover?
According to the U.S. Bureau of Labor Statistics JOLTS report for January 2026, accommodation and food services leads at 5.2% monthly (roughly 62% annualized), followed by leisure and hospitality overall at 5.4%. Professional and business services came in at 4.6% monthly, construction at 3.6%, and retail at 3.5%. Government had the lowest rate at 1.2% monthly.
How much does it cost to replace an employee?
Work Institute estimates 33% of annual salary as a conservative baseline. Gallup's research puts the full range at 0.5 to 2 times annual salary depending on role complexity. A $60,000 employee costs between $30,000 and $120,000 to replace — and that range widens significantly for credentialed clinical, technical, or management roles. Use HR Cloud's Employee Turnover Calculator to model your specific headcount, salary mix, and exit volume.
What percentage of turnover is preventable?
Work Institute's 2025 Retention Report estimates approximately 75% of voluntary departures are preventable, based on analysis of over 120,000 exit interviews. The most common preventable drivers include lack of career development (56.3% of employees cite advancement paths as a key retention factor, per iHire's 2024 Talent Retention Report), poor management relationships (Gallup research shows at least 75% of voluntary turnover reasons can be influenced by managers), insufficient recognition, and workplace culture issues. Most are fixable with intentional intervention — the first step is knowing which one is actually driving your exits, not which one sounds most plausible.
What does turnover look like in the first year?
The highest-risk window is the first 12 months. Sixty-one percent of departures happen within year one, with 54% leaving before the six-month mark. This makes structured onboarding the highest-leverage early retention intervention — not perks or culture initiatives, but a consistent, documented process that every new hire goes through regardless of which manager is doing the hiring. Seasonal patterns layer on top: construction turnover clusters in winter, hospitality spikes around peak seasons, and education settings see predictable attrition each June and August.

Tamalika Biswas Sarkar
I'm Tamalika Biswas Sarkar, a content specialist focused on creating clear, engaging, and insightful content around HR, workplace trends, and the future of work. I craft content that helps organizations communicate more effectively, strengthen their brand voice, and connect with their audience through well-researched and thoughtfully written pieces.
Keep Reading
Top 10 Employee Communication Software of 2026.
Internal message failures cost businesses millions every single year in lost work hours.
Best Employee Recognition Software
Large enterprises drop billions of dollars every year. The culprit is employee drift and
Selecting the Right Employee Survey Software for Your Enterprise in 2026
Our leadership team sat in a quiet room, staring at a whiteboard that read eighteen