Employee Engagement Metrics Every Organization Should Track

You're running pulse surveys, tracking eNPS, maybe even measuring participation in your recognition program. Yet when your CEO asks, "Is our workforce actually engaged?" you hesitate, because you're not sure your data answers that question.
You're not alone. According to Gallup's 2025 State of the Global Workplace report, global employee engagement fell to just 21% in 2024, costing the world economy an estimated $438 billion in lost productivity. The companies that outperform that benchmark aren't just surveying more frequently. They're tracking the right employee engagement metrics, connecting those metrics to business outcomes, and acting on what the data reveals.
This guide covers the 10 employee engagement metrics that reliably predict retention, productivity, and organizational health. For each metric, you'll find the formula, what "good" looks like, and how to interpret what the numbers are actually telling you.
If you're still building your foundational understanding of what employee engagement means and why it matters, start there first. This post assumes you're ready to measure it.
Why Tracking Employee Engagement Metrics Matters More Than Ever
The case for measurement has gotten stronger, and more urgent.
Gallup's 2025 data found that 70% of the variance in team engagement is attributable to the manager. That's a staggering concentration of influence. And manager engagement itself dropped from 30% to 27% in 2024, with the steepest declines among managers under 35 and female managers.
The problem is cascading. Disengaged managers create disengaged teams. And if you're only measuring engagement at the company level through annual surveys, you're averaging away the signal. You need metrics that work at the team level, update frequently enough to be actionable, and connect directly to business outcomes your leadership cares about.
The financial stakes are equally specific. According to SHRM research, replacing a single employee can cost between 50% and 200% of their annual salary, depending on the role and seniority. In healthcare, the 2025 NSI National Health Care Retention Report puts the average cost of turnover for one staff RN at $61,110, with the average hospital losing between $3.9 million and $5.7 million annually to nursing turnover alone.
Those numbers make one thing clear: measuring engagement isn't an HR exercise. It's a financial imperative.
The 10 metrics below fall into three categories: leading indicators (they predict future engagement shifts), lagging indicators (they confirm what already happened), and sentiment indicators (they capture how employees feel right now). A strong measurement system includes all three.
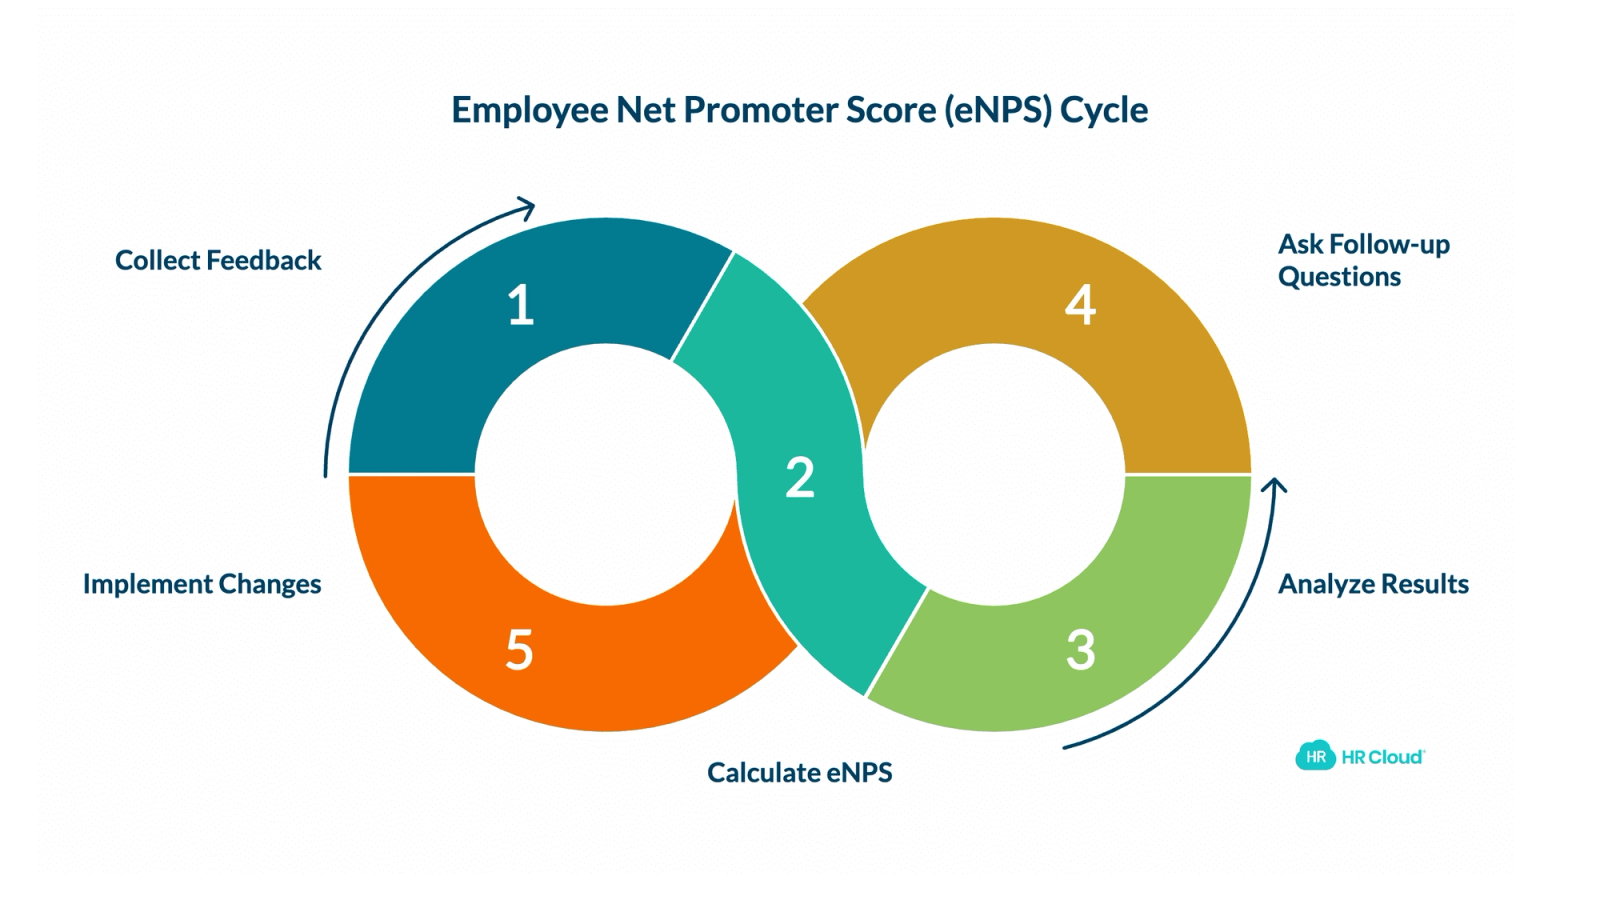
1. Employee Net Promoter Score (eNPS)
Type: Sentiment indicator
The question: "On a scale of 0 to 10, how likely are you to recommend this company as a place to work?"
How to calculate it:
eNPS = (% of Promoters − % of Detractors)
Promoters score 9 or 10. Passives score 7 or 8. Detractors score 0 through 6.
What good looks like: An eNPS above 30 is strong. Above 50 is excellent. Most organizations land between 10 and 30.
Why it matters: eNPS is the single fastest read on overall employee sentiment. It tells you whether people are proud to work at your organization or quietly browsing LinkedIn on their lunch break. What it doesn't tell you is why. So always pair eNPS with at least one open-ended follow-up question: "What's the primary reason for your score?"
Where organizations go wrong: Measuring eNPS annually and treating the number as the whole story. eNPS is a thermometer. It tells you the temperature. You still need to diagnose the cause. A hospital system tracking eNPS at the facility level, for example, might find scores of 45 at one campus and 12 at another. The metric doesn't explain the gap, but it tells you exactly where to investigate.
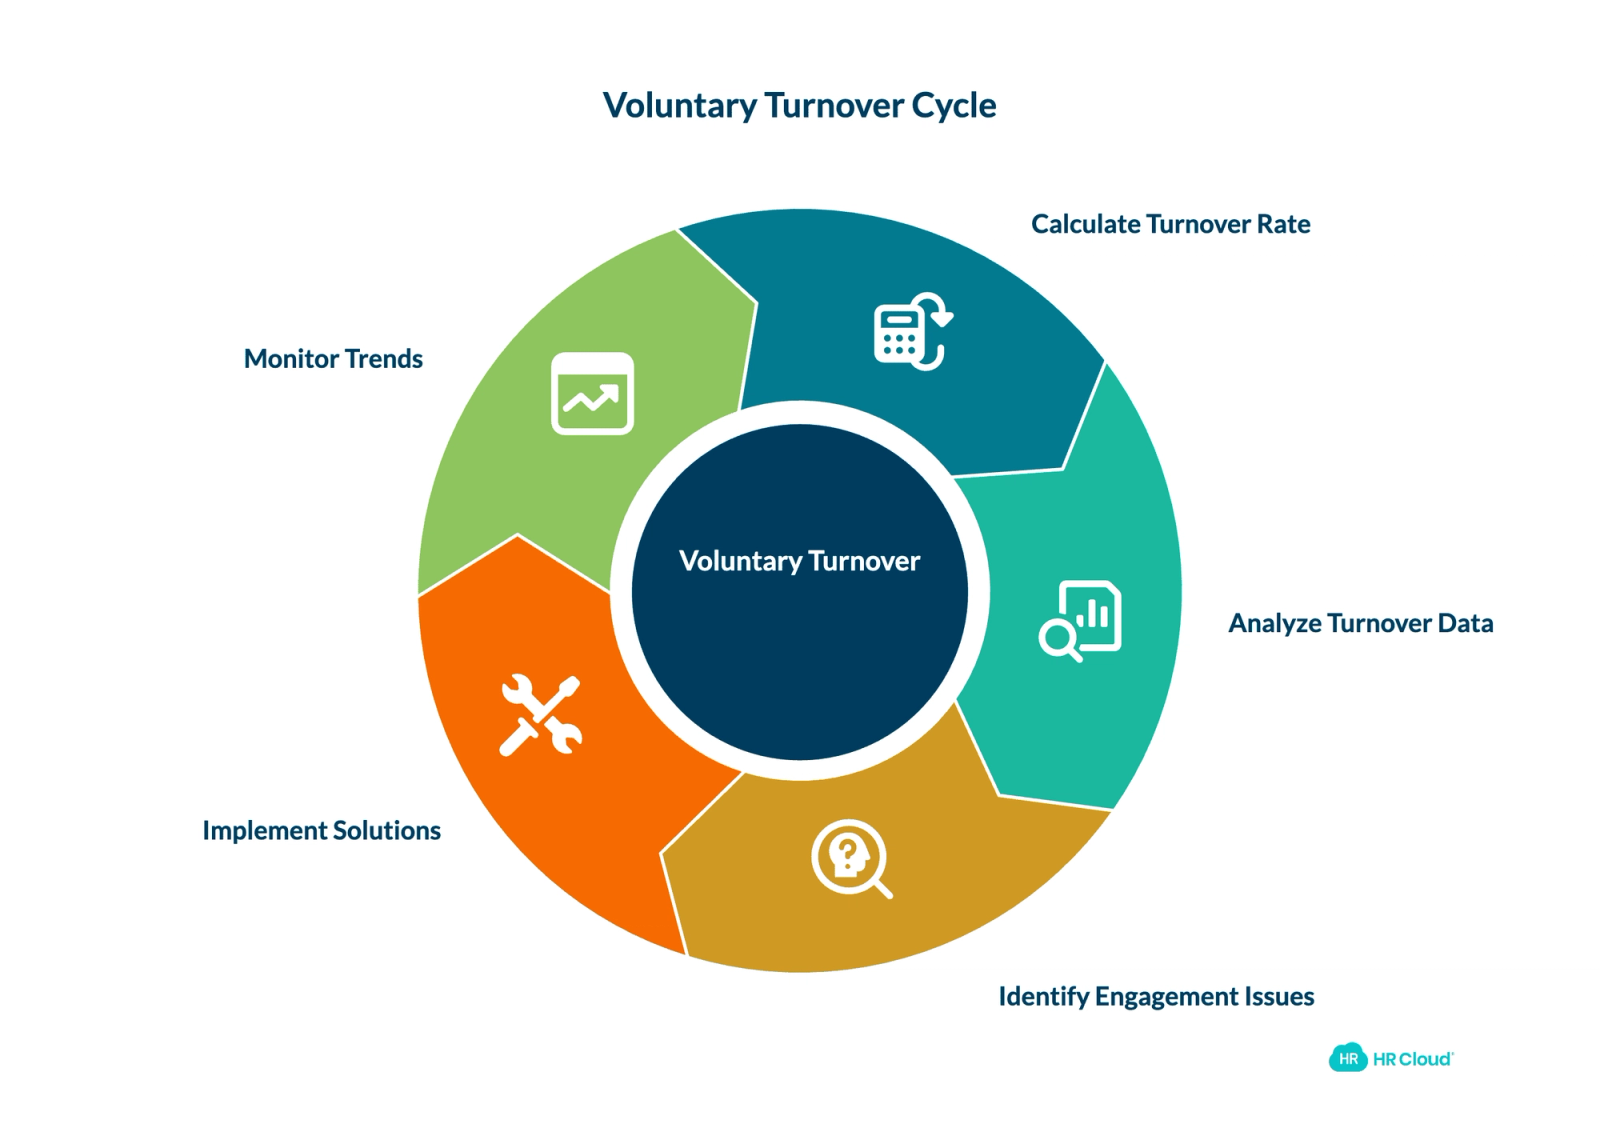
2. Voluntary Turnover Rate
Type: Lagging indicator
How to calculate it:
Voluntary Turnover Rate = (Number of voluntary separations during period ÷ Average number of employees during period) × 100
What good looks like: This varies significantly by industry. According to the 2025 NSI National Health Care Retention Report, the national RN turnover rate was 16.4% in 2024, down from a pandemic peak of 27.1%. Tech companies may target under 12%. Manufacturing turnover averages around 18-19% according to BLS data, though companies with strong safety cultures and internal development programs often run significantly lower. The benchmark that matters most is your own trend line over time.
Why it matters: Voluntary turnover is the ultimate lagging indicator of engagement failure. When someone chooses to leave, it's usually the end of a disengagement pattern that started months earlier. The value of tracking turnover isn't the number itself. It's what you learn when you slice it by department, tenure band, and manager.
The manager connection: If one manager's team has 30% voluntary turnover while comparable teams are at 12%, that's an engagement problem with a specific address. You don't need another survey. You need a coaching conversation. Drill deeper: is it first-year turnover (which signals onboarding problems) or 2-4 year turnover (which signals growth ceiling frustration)?
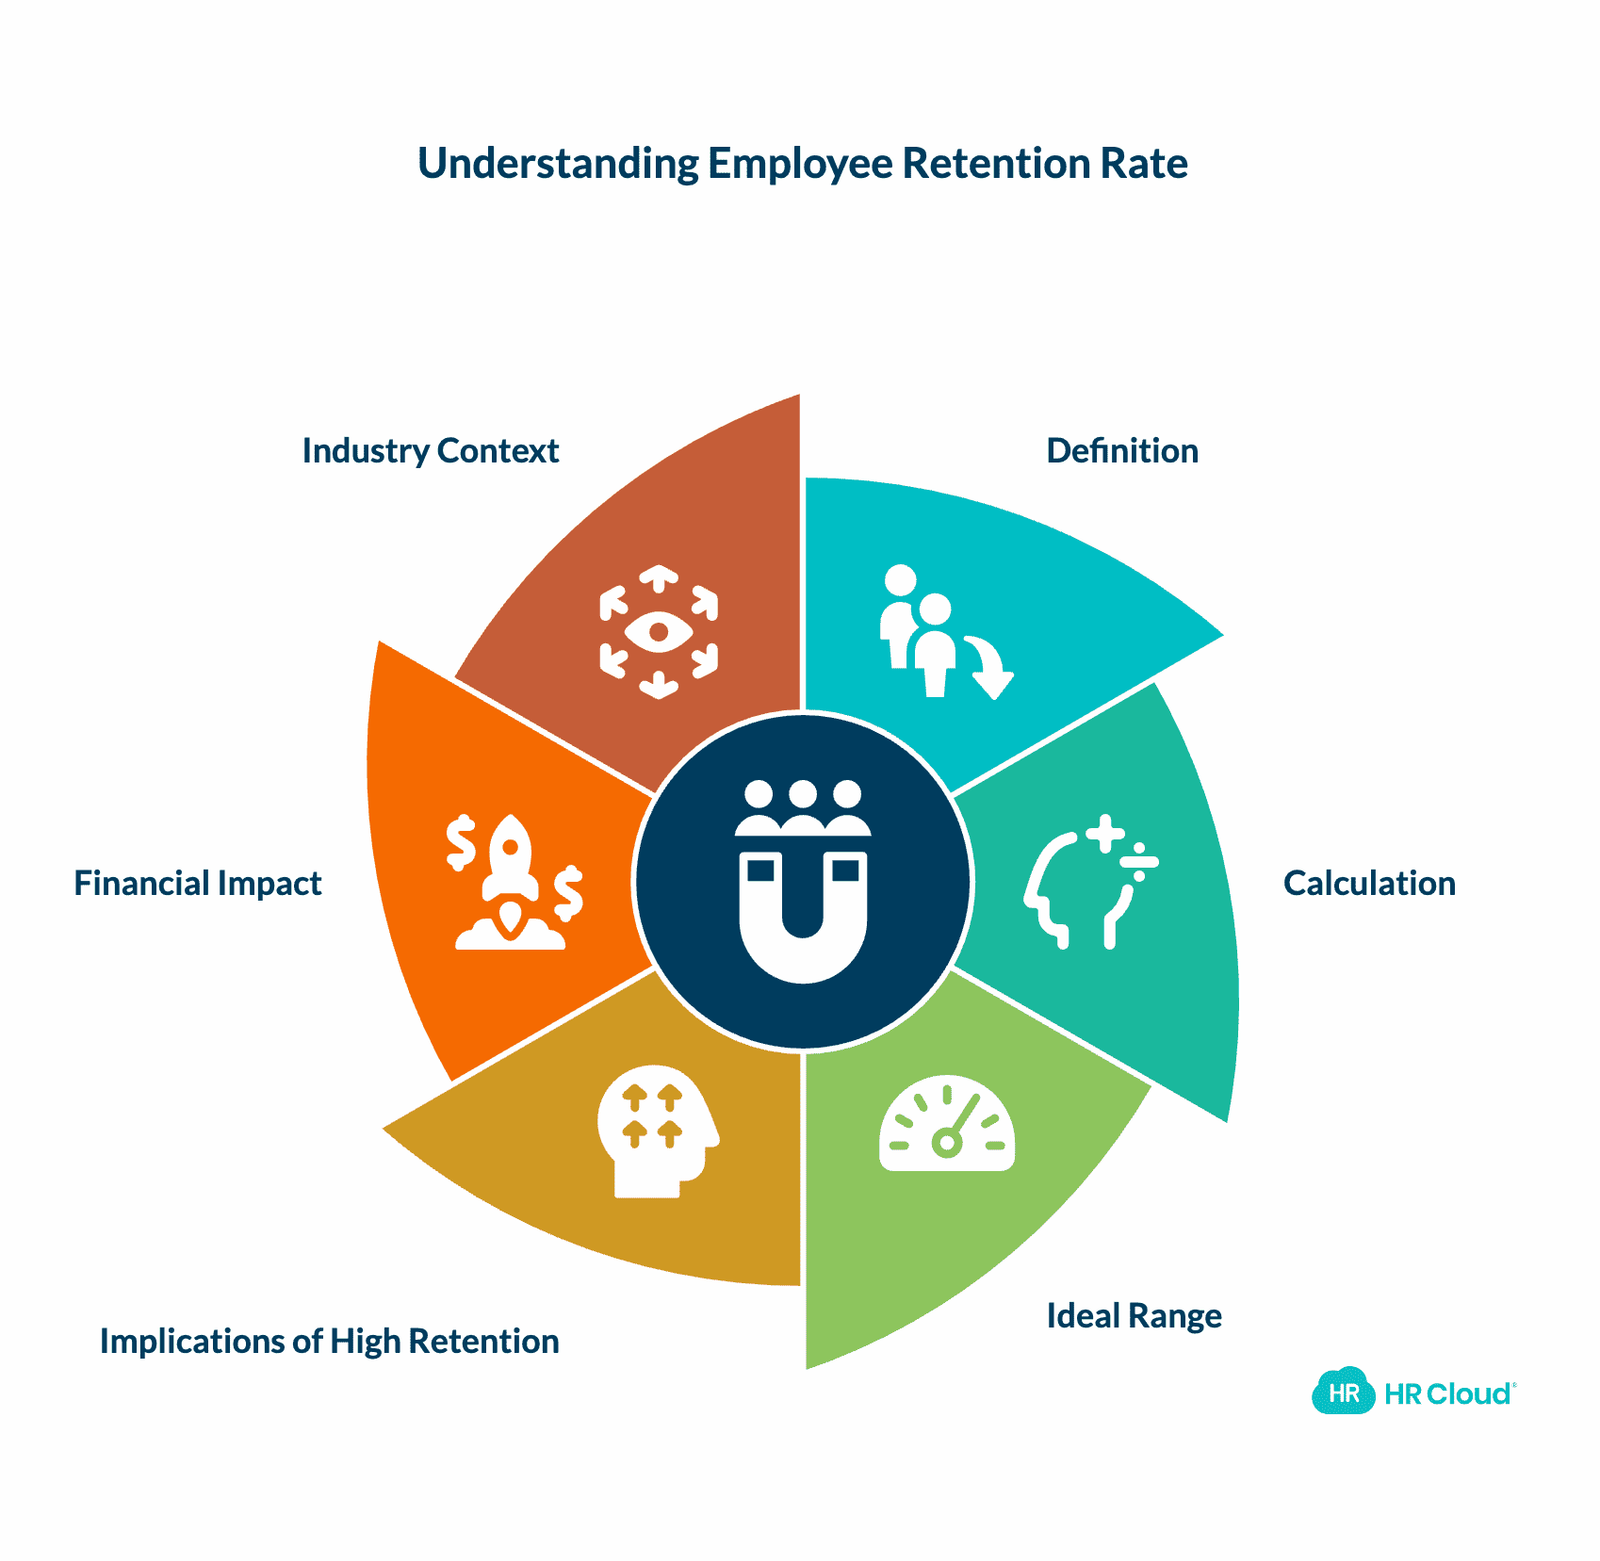
3. Employee Retention Rate
Type: Lagging indicator
How to calculate it:
Retention Rate = ((Total employees at start of period − Total who left during period) ÷ Total employees at start of period) × 100
What good looks like: Most organizations target 85-90% annual retention. A rate consistently above 90% suggests strong engagement, though very high retention (98%+) combined with low performance ratings could signal a different problem: complacency rather than commitment.
Why it matters: Retention rate is the inverse view of turnover, but it carries a different psychological weight in leadership conversations. Saying "we retained 92% of our workforce" frames the narrative around success and momentum. It's also the metric that connects most directly to real dollars. Use HR Cloud's employee turnover cost calculator to translate your retention rate into specific financial impact for your leadership team.
Industry context: Healthcare organizations should track retention at the unit level, not just facility-wide. A 90% overall retention rate can mask 70% retention on a night-shift med-surg unit, which is where the operational pain actually lives. Construction and manufacturing companies benefit from tracking retention by crew or shift for the same reason.

4. Absenteeism Rate
Type: Leading indicator
How to calculate it:
Absenteeism Rate = (Total unplanned absent days ÷ Total available working days) × 100
What good looks like: The Bureau of Labor Statistics reports the average U.S. absence rate at approximately 3.6%. Rates consistently above 5% warrant investigation. Above 7%, you almost certainly have deeper engagement or culture issues at play.
Why it matters: Rising absenteeism is often the first visible signal of declining engagement, showing up weeks or months before turnover does. Unplanned absences (excluding approved PTO and FMLA leave) create a pattern that, tracked at the team level, surfaces manager effectiveness problems, workload imbalances, or emerging burnout.
Where this metric becomes critical: In healthcare, one absent nurse triggers a cascade of mandatory overtime, increased patient-to-staff ratios, and elevated risk. In manufacturing, one absent line worker slows an entire shift. In construction, it's a safety liability. For these industries, absenteeism isn't just an engagement metric. It's an operational risk indicator. That's why tracking it at the team and shift level, not just company-wide, matters so much.
Gallup's research shows that top-quartile engagement teams experience 81% lower absenteeism than bottom-quartile teams. That's not a marginal improvement. It's a different operating model.
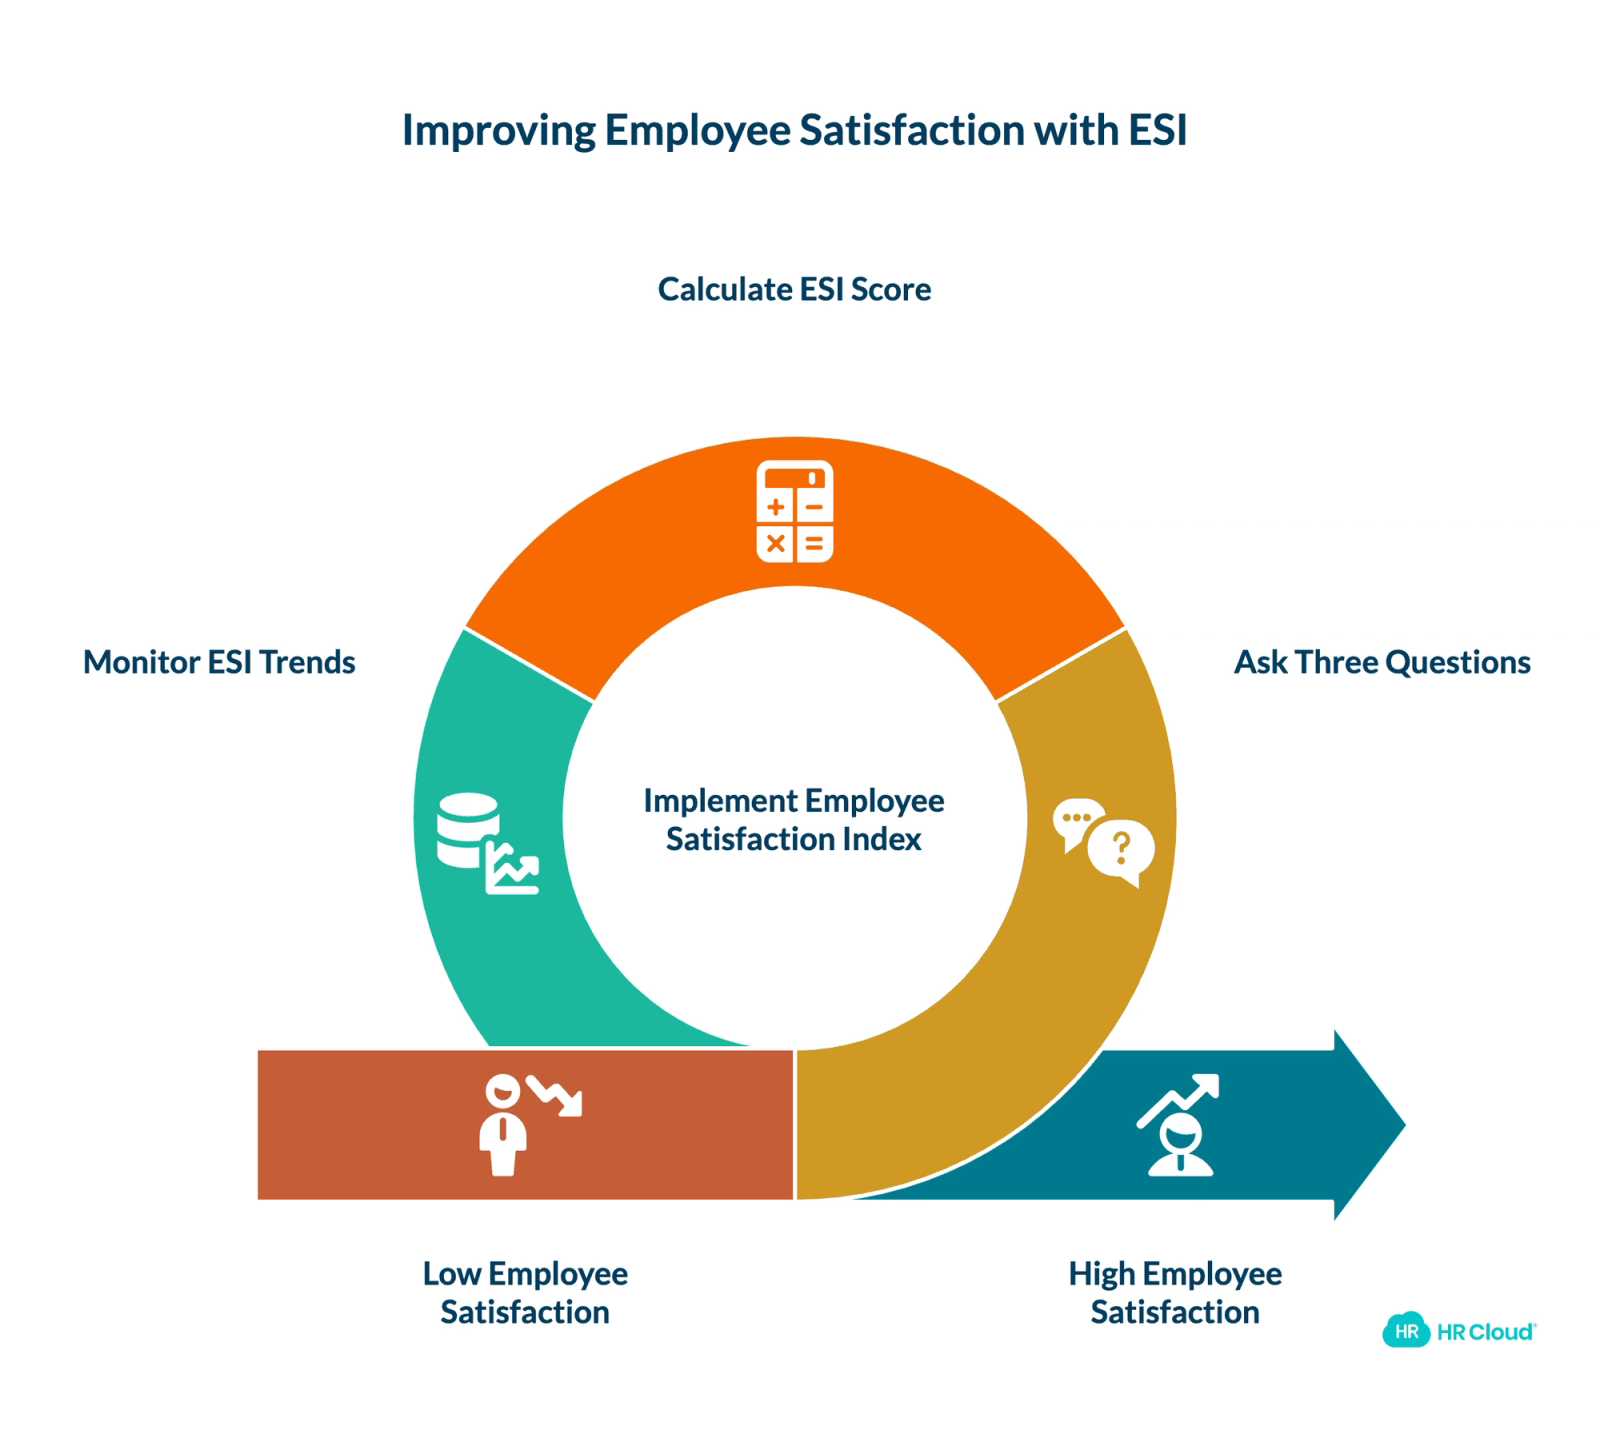
5. Employee Satisfaction Index (ESI)
Type: Sentiment indicator
How to calculate it:
Ask employees three questions on a scale of 1 to 10:
1. How satisfied are you with your current workplace?
2. How well does your current workplace meet your expectations?
3. How close is your current workplace to your ideal workplace?
ESI = ((Mean value of responses ÷ 3) × 100)
What good looks like: An ESI above 70 is generally healthy. Below 60 signals areas that need immediate attention.
Why it matters: ESI sits between eNPS (which measures advocacy) and comprehensive engagement surveys (which measure connection to work). It's lightweight enough to deploy monthly without creating survey fatigue, and specific enough to track meaningful changes in how employees feel about the workplace environment itself.
The distinction that matters: Satisfaction and engagement are not the same thing. An employee can be satisfied with pay and conditions but still not engaged. True employee engagement means emotional investment in outcomes, willingness to contribute discretionary effort, and alignment with organizational goals. ESI measures the foundation. Engagement surveys measure the building you construct on top of it.
6. Productivity Metrics (Revenue Per Employee)
Type: Lagging indicator
How to calculate it:
Revenue Per Employee = Annual company revenue ÷ Average number of employees
What good looks like: This varies enormously by industry and business model. The benchmark is your own year-over-year trend. A declining revenue-per-employee ratio alongside growing headcount could signal engagement problems slowing output.
Why it matters: Productivity is the metric that makes engagement tangible to finance teams and the C-suite. According to Gallup's research, business units in the top quartile of engagement see 23% higher profitability compared to those in the bottom quartile. When you pair engagement scores with productivity data, you create a narrative that connects people investment to revenue outcomes. That's the language that unlocks budget for engagement programs.
Adapting for your industry: For organizations where individual revenue attribution is difficult (healthcare, education, professional services), use throughput metrics appropriate to the role: patients seen per shift, student outcomes per term, project completion rates per quarter, or units produced per shift. The principle is the same: connect engagement data to output data, whatever "output" means in your context.
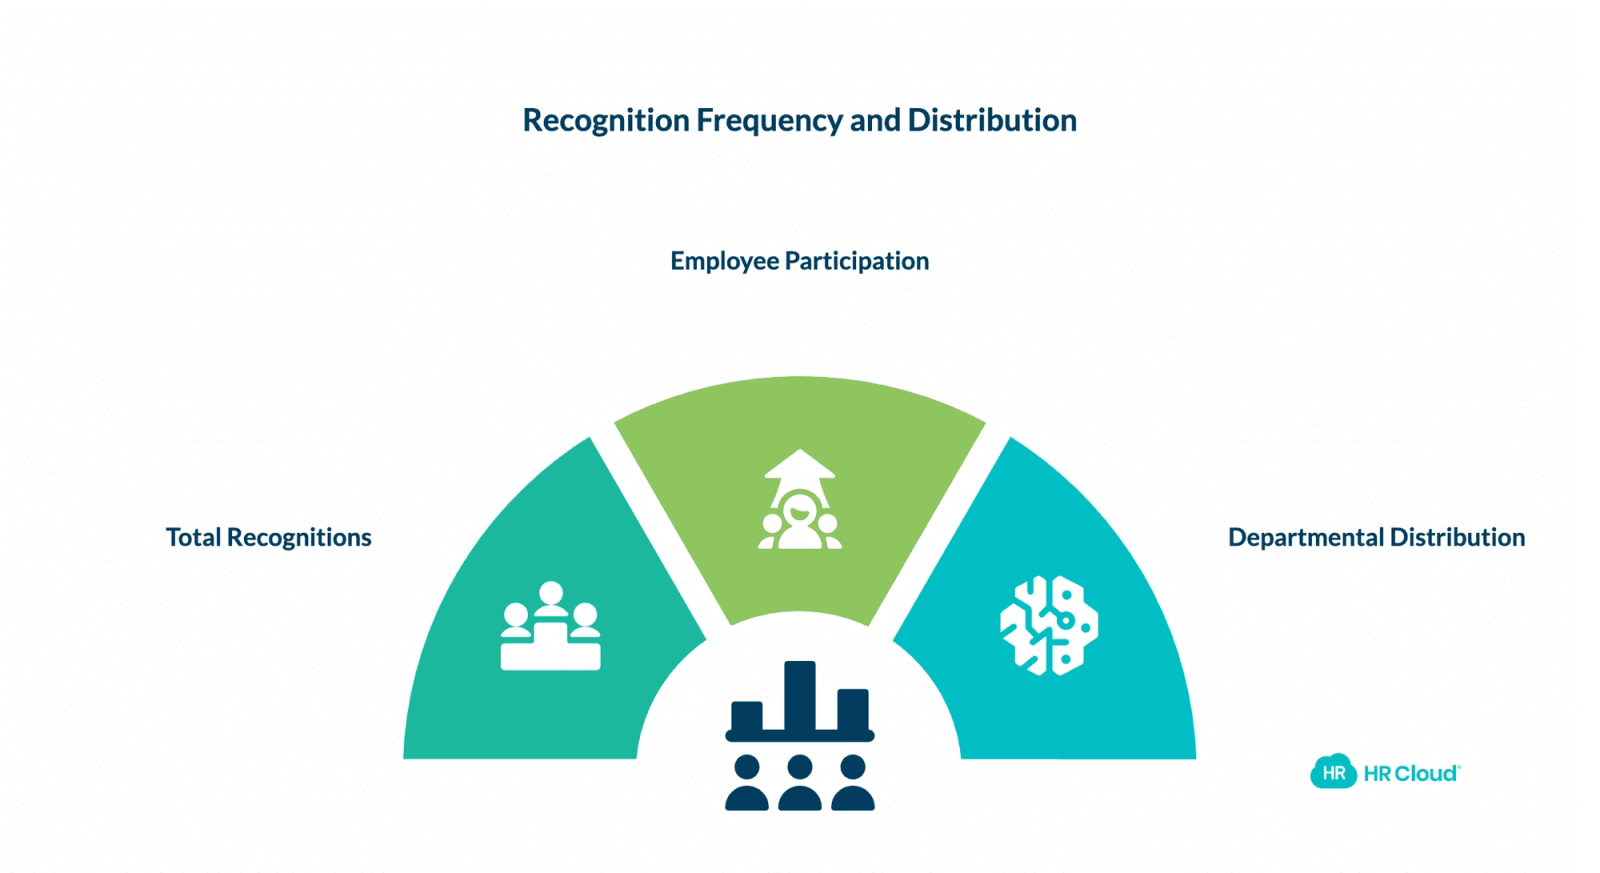
7. Recognition Frequency and Distribution
Type: Leading indicator
How to calculate it:
Track three things:
- Total recognitions given per month (company-wide)
- Percentage of employees who received at least one recognition in the last 30 days
- Distribution of recognition across departments and managers
What good looks like: Aim for at least 80% of employees receiving recognition from either a peer or manager at least once per month. If recognition is concentrated in 2 or 3 departments while others receive almost none, you have a cultural inconsistency that will show up in your other metrics within a quarter or two.
Why it matters: Recognition is the most direct behavioral predictor of engagement. Employees who feel acknowledged for their contributions are more likely to stay, perform, and recommend the organization. The frequency and distribution of recognition tell you whether your culture reinforces the behaviors you want, or whether it runs on autopilot.
For organizations using a platform like HR Cloud's Workmates, this data is tracked automatically: who's recognizing whom, how often, and how participation maps across the org chart. That visibility turns recognition from a feel-good initiative into a measurable engagement driver. You can spot which managers actively reinforce their teams and which ones haven't sent a single recognition in 90 days.
The frontline factor: Recognition tracking becomes especially important for deskless and frontline workers in healthcare, manufacturing, and construction, where employees may not have daily access to email or company intranets. Mobile-first recognition platforms ensure these workers aren't invisible in your engagement data.
8. Engagement Survey Participation Rate
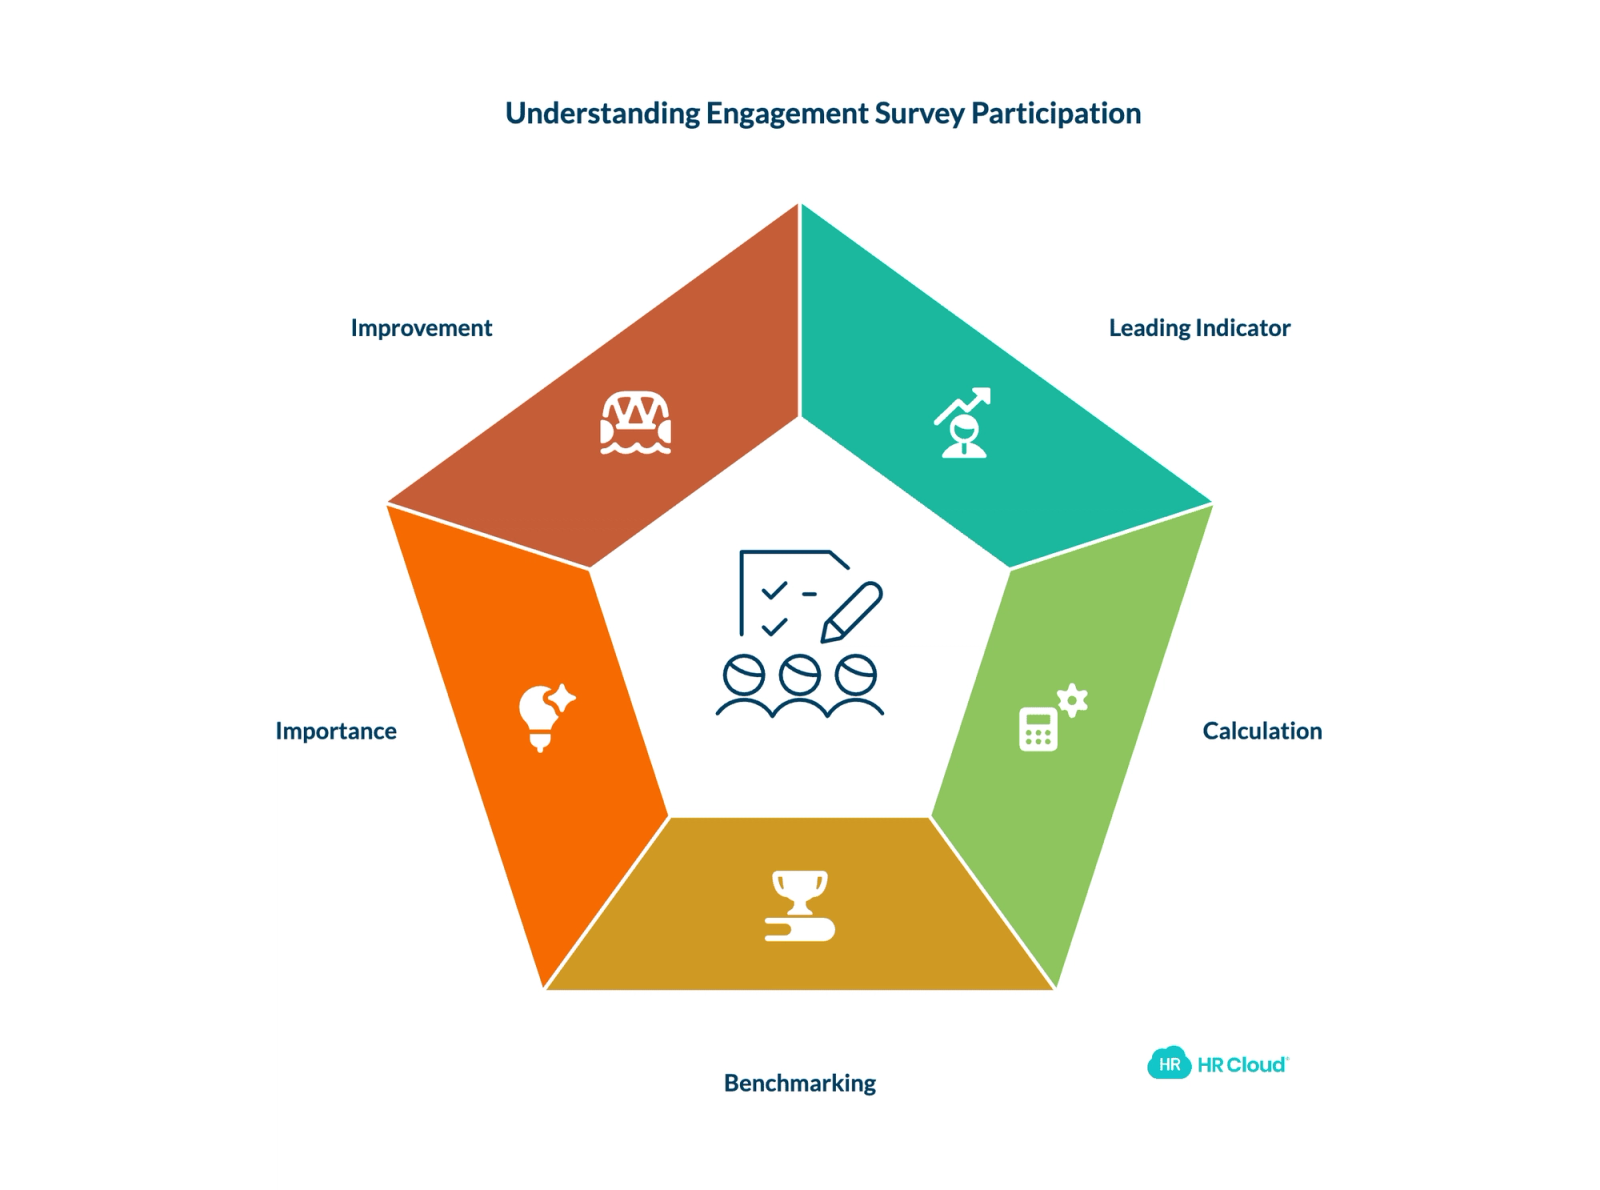
Type: Leading indicator
How to calculate it:
Participation Rate = (Number of completed surveys ÷ Total number of employees invited) × 100
What good looks like: Best-in-class organizations see 80-90% survey participation. Below 60% means either your employees don't trust the process, don't believe action will follow, or both.
Why it matters: Most organizations obsess over their survey scores and overlook participation rate entirely. That's a mistake. Participation rate itself is an engagement metric. Employees who care enough to complete a survey are signaling willingness to invest in improving the workplace. Low participation is telling you something important: people have stopped believing their voice leads to change.
What kills participation (and how to fix it): Employees have seen this pattern before. They fill out surveys, leadership reviews the results in a strategy meeting, and nothing visible changes. The fastest way to increase participation is to close the loop publicly. Share what you learned. Name the specific actions you're taking. Credit the feedback that prompted the change. When people see that speaking up leads to real outcomes, participation rises on its own.
For practical guidance on building surveys that drive both participation and actionable insight, we've published a companion guide.
9. Internal Mobility Rate
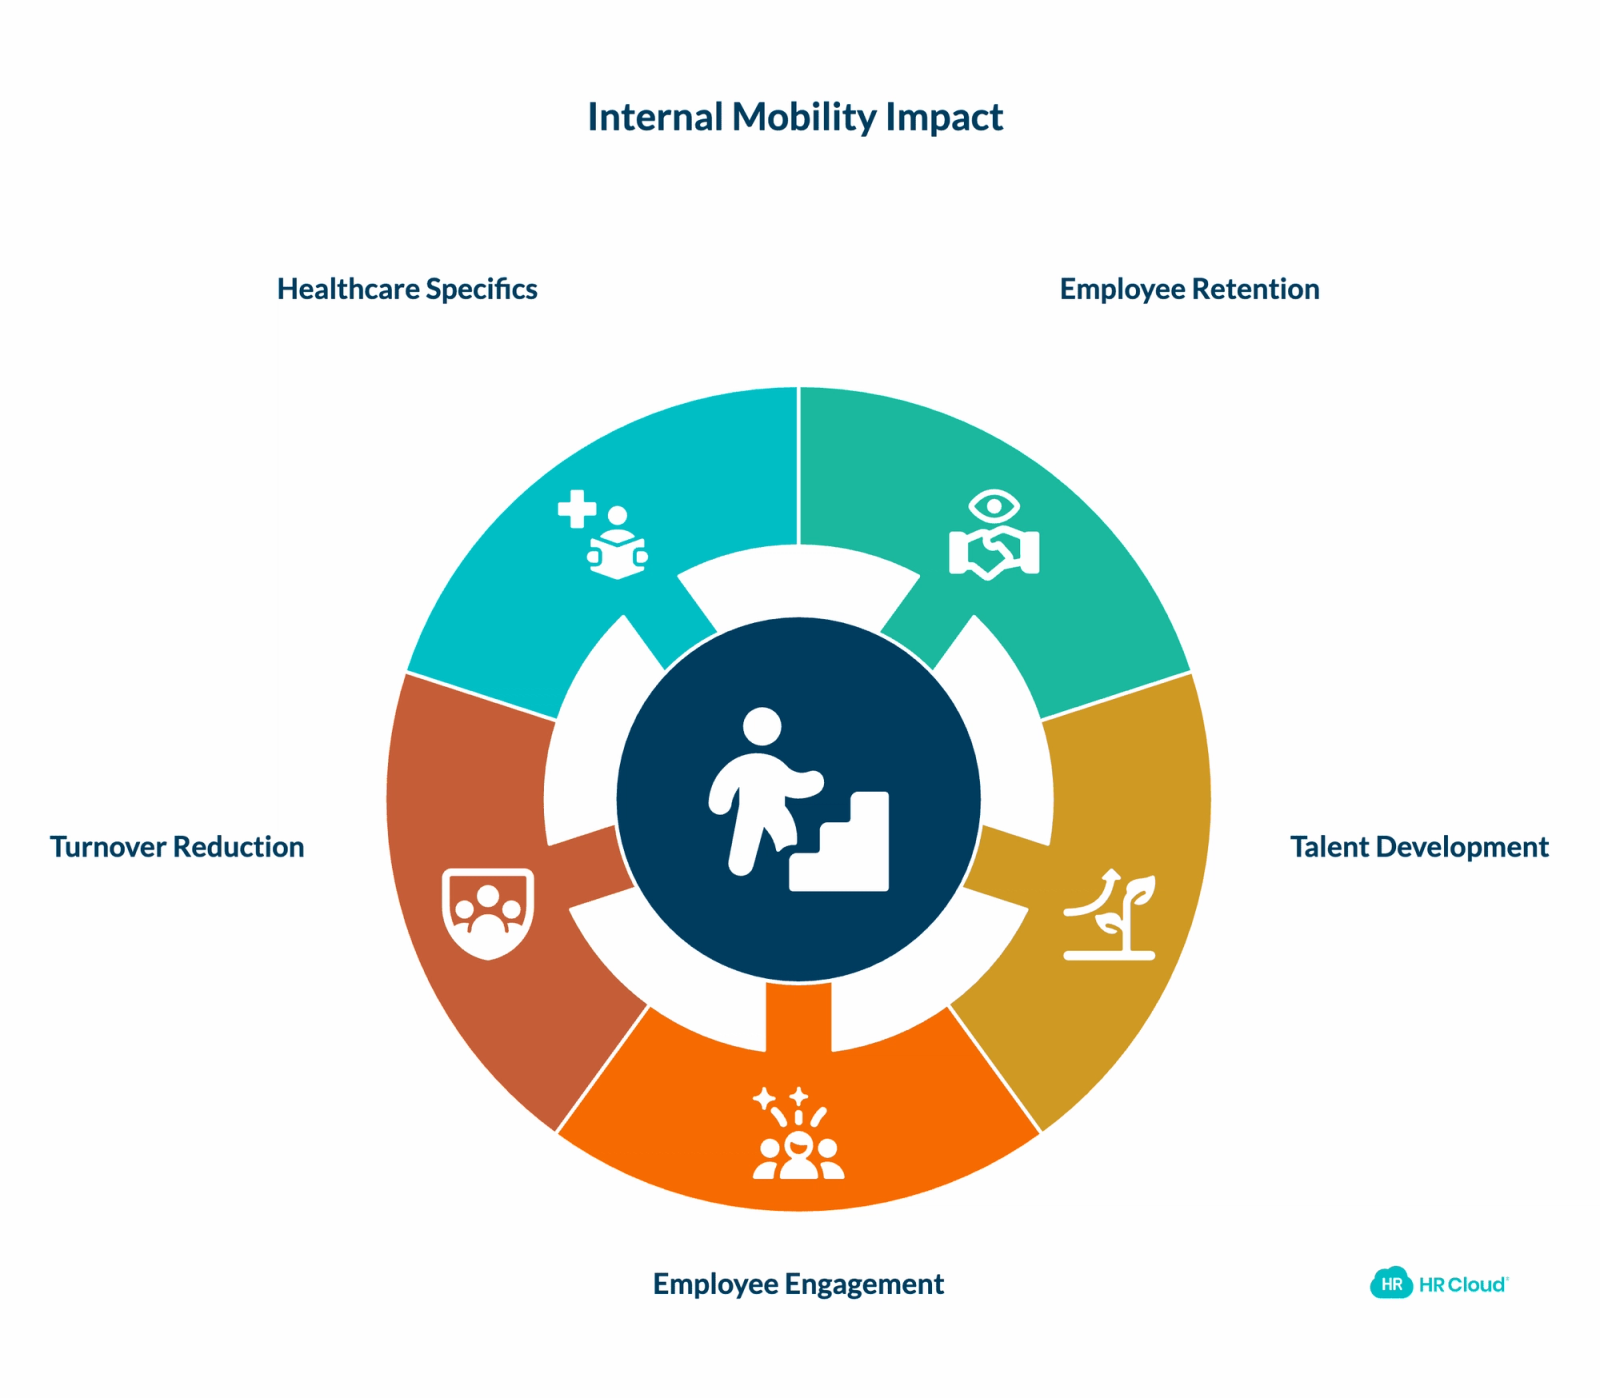
Type: Leading indicator
How to calculate it:
Internal Mobility Rate = (Number of internal transfers, promotions, or role changes ÷ Total headcount) × 100
What good looks like: Organizations with strong engagement typically see internal mobility rates of 15-25% annually. Below 10% may suggest limited career growth opportunities, which consistently ranks as a top driver of voluntary turnover across every industry.
Why it matters: This metric answers a question that no survey can fully capture: do employees see a future here? When people can grow into new roles, take on stretch assignments, or transfer to departments that align with their evolving interests, they stay longer and contribute more. When internal paths are blocked, your most ambitious people leave first. And those are exactly the people you can least afford to lose.
Internal mobility is especially powerful when cross-referenced with engagement survey data and performance ratings. If high-performing, highly engaged employees are the ones moving internally, your career infrastructure is working. If your internal movers are predominantly low-performers looking for a fresh start, the signal is very different, and your response should be different too.
For healthcare organizations: Internal mobility can look like a med-surg nurse transitioning to the ICU, a CNA pursuing an LPN bridge program, or a clinical coordinator moving into HR. Tracking these moves tells you whether your organization is developing talent from within or losing it to competitors who offer a clearer path.
10. Manager Effectiveness Score
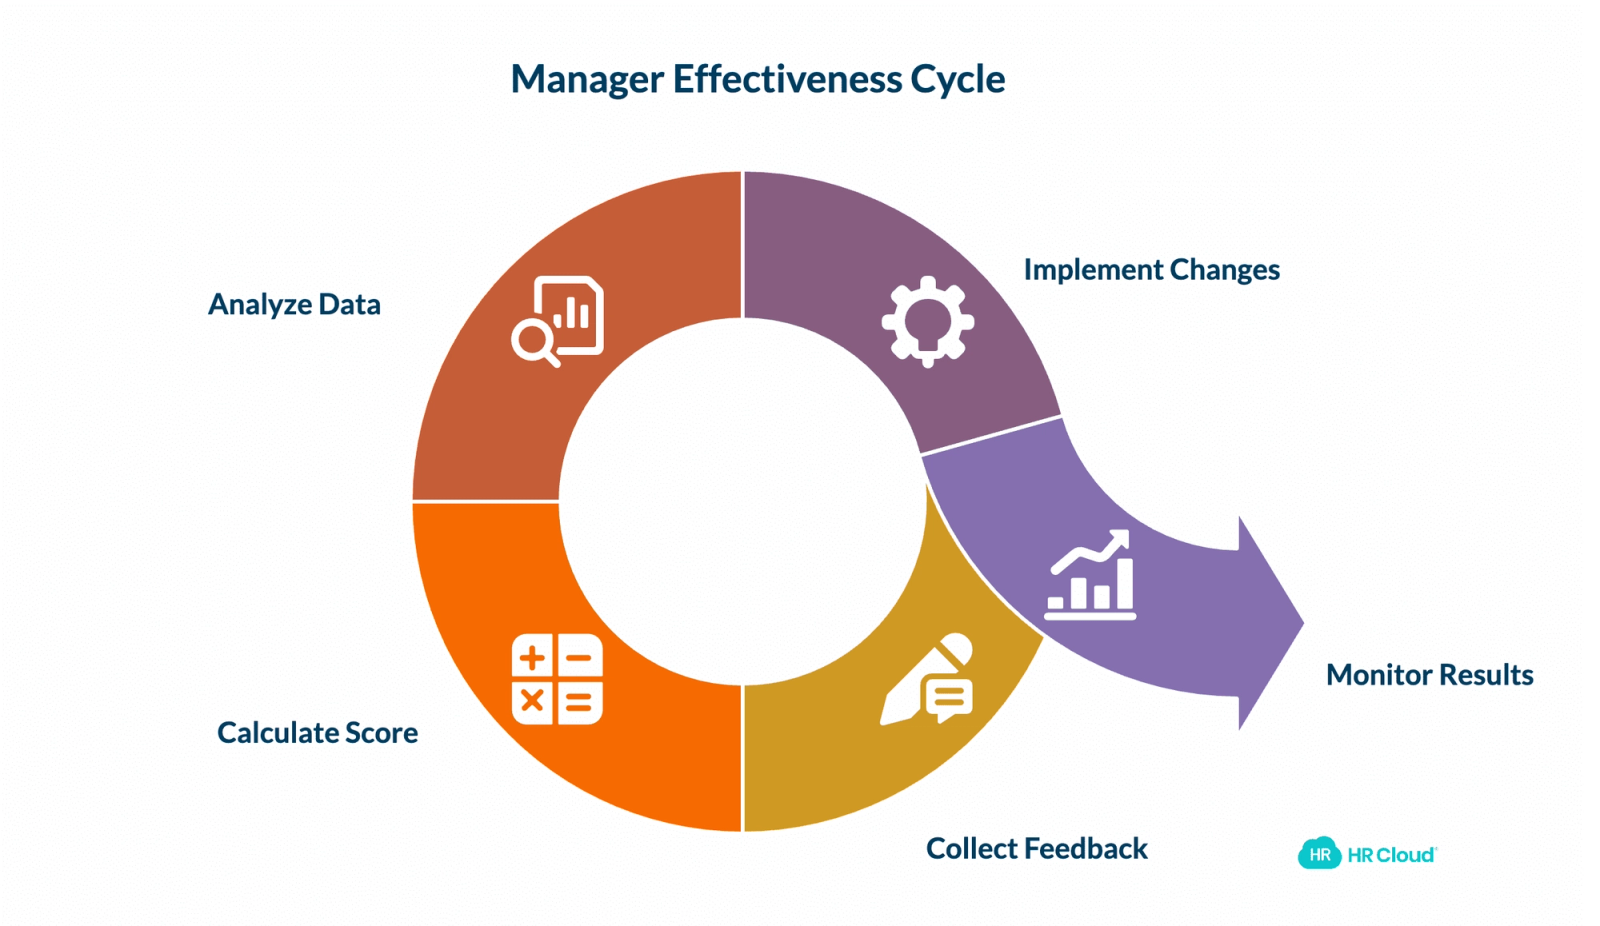
Type: Sentiment indicator (with strong leading characteristics)
How to calculate it:
Include 3-5 manager-specific questions in your engagement survey. Questions that consistently predict team outcomes:
- "My manager cares about me as a person" (1-5 scale)
- "I receive meaningful feedback from my manager at least once a month"
- "My manager helps me understand how my work connects to our team's goals"
- "My manager acts on the feedback our team provides"
Manager Effectiveness Score = Average rating across manager-related questions
What good looks like: Teams with manager effectiveness scores above 4.0 (on a 5-point scale) consistently outperform on every other engagement metric on this list. Below 3.0, expect elevated turnover within 6-12 months.
Why it matters: This is the metric that connects everything else. Gallup's data showing that 70% of team engagement depends on the manager means that every other metric in this guide is downstream of manager behavior. If your eNPS is low, your turnover is climbing, and your absenteeism is spiking, the root cause is often sitting in your manager effectiveness data.
Tracking this metric also tells you where to invest. Rather than company-wide engagement initiatives that spread resources thin, you can target manager coaching and performance development where the data says it'll make the biggest difference.
We've seen organizations discover that 80% of their voluntary turnover is concentrated under fewer than 15% of their managers. In those cases, the answer isn't a new engagement strategy. It's targeted manager development for a specific group. Organizations that take this approach consistently see turnover in affected teams drop within two to three quarters.
How to Choose Which Employee Engagement Metrics to Prioritize
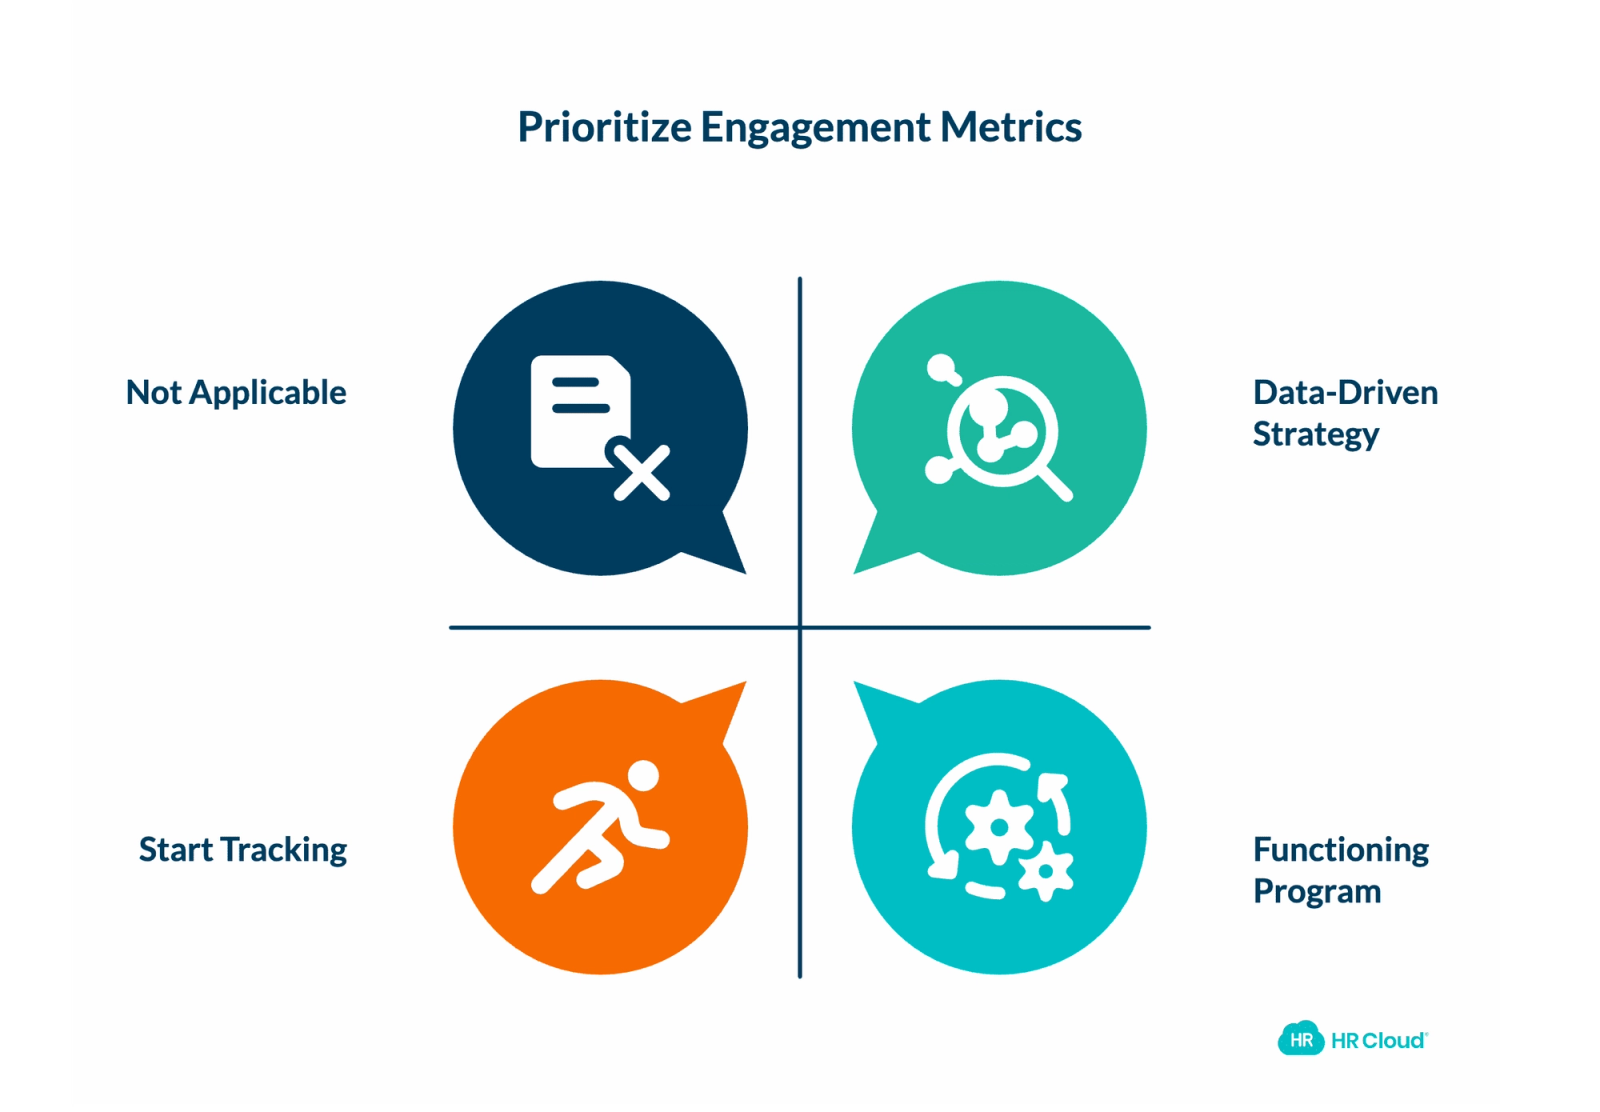
You don't need to track all 10 metrics with equal intensity. Start with what your organization can actually act on, then expand as your measurement capability matures.
If you're just starting out: Begin with eNPS, voluntary turnover rate, and engagement survey participation. These three give you sentiment, outcomes, and process health with minimal infrastructure. You can start tracking them this month.
If you have a functioning engagement program: Add absenteeism, recognition frequency, and manager effectiveness scores. These tell you whether your program is reaching the right people and driving the right behaviors at the team level.
If you're building a data-driven engagement strategy: Layer in internal mobility, ESI, productivity metrics, and retention rate by tenure band. At this stage, you're looking for patterns across metrics and building predictive models that identify at-risk teams before the damage shows up in turnover numbers.
The key principle: no single metric tells the whole story. A rising eNPS alongside steady turnover might mean employees feel optimistic but aren't yet seeing material changes. High participation rates on surveys with declining satisfaction scores mean people care enough to speak up, and they're telling you something important. The value is in the pattern, not any individual number.
Putting Employee Engagement Metrics Into Action
Data without action breeds cynicism faster than no data at all. If you survey your people and nothing changes, you've actually made engagement worse. Every metric you track should connect to a decision you're willing to make.
Here's how to close the loop:
Set review cadences that match the metric type. Pulse metrics (eNPS, ESI) monthly. Operational metrics (turnover, absenteeism, recognition) quarterly. Comprehensive surveys annually. Resist the temptation to survey more often if you're not acting on what you already have.
Segment everything. Company-wide averages hide the real story. Break every metric down by department, manager, location, tenure band, and shift. The variance within your organization is where the actionable intelligence lives. Consider a hospital system that discovers its night-shift absenteeism rate is 3x higher than day-shift on the same unit. That team doesn't need a new engagement program. It needs investigation into what's happening on nights: a scheduling conflict, a manager issue, a broken equipment escalation process. Three targeted fixes can reduce absenteeism meaningfully within a single quarter.
Share transparently. Publish engagement dashboards that managers can access for their own teams. When managers see their team's recognition frequency or engagement participation rate alongside peer teams, behavior shifts without anyone sending a directive.
Connect metrics to engagement strategies that actually work. Metrics identify the problem. Strategies solve it. If your data reveals low manager effectiveness in one division, the response should be targeted manager development, not another company-wide town hall. If recognition is concentrated in three departments, the response is coaching under-recognizing managers, not launching a new rewards catalog.
Make dashboards accessible where managers work. For organizations managing 200-2,500 employees across multiple locations, especially in industries like healthcare, manufacturing, or construction where frontline workers don't sit at desks, the gap between "data exists" and "managers act on data" is often a technology gap. HR Cloud's engagement analytics are built for exactly this scenario: real-time dashboards, mobile-accessible, with alerts that surface engagement risks at the team level before they become retention crises.
Managing employee engagement metrics at scale takes more than spreadsheets and good intentions. It takes a platform that captures recognition, communication, and sentiment data in one place, and surfaces it where managers can act. See how HR Cloud helps organizations across healthcare, manufacturing, and education turn engagement data into retention results.
Experience how Workmates can transform communication and strengthen culture—all in one powerful platform
Book Your Free DemoFrequently Asked Questions
What are the most important employee engagement metrics?
The most important employee engagement metrics depend on your organization's maturity and what you can act on today. For most companies, employee Net Promoter Score (eNPS), voluntary turnover rate, and engagement survey participation provide the strongest starting foundation. As you build measurement capability, add recognition frequency, absenteeism rate, and manager effectiveness scores. No single metric captures engagement fully. A combination of leading indicators, lagging indicators, and sentiment measures gives the most accurate and actionable picture.
How do you measure employee engagement without surveys?
Surveys are the most common method, but you can also measure engagement through operational data: voluntary turnover and absenteeism rates, internal mobility patterns, recognition frequency, productivity metrics, and participation in optional company events. Stay interviews, where you ask current employees what keeps them and what might cause them to leave, provide qualitative insight that supplements quantitative data. Platforms like Workmates also track behavioral signals such as recognition activity, channel participation, and content engagement, which serve as real-time proxies for engagement between formal surveys.
How often should you measure employee engagement?
Most organizations benefit from annual comprehensive surveys paired with monthly or quarterly pulse checks. Pulse surveys of 3-5 questions, taking under 2 minutes to complete, track sentiment shifts between larger surveys. Operational metrics like turnover, absenteeism, and recognition frequency should be reviewed monthly. The goal is continuous visibility without creating survey fatigue. More importantly, never increase survey frequency if you haven't acted on the last round of results.
What is a good employee engagement score?
This depends on your measurement tool. For eNPS, above 30 is strong and above 50 is excellent. For engagement surveys using a 5-point scale, an average of 3.8 or above is considered healthy, with top-performing organizations reaching 4.2+. The most useful benchmark is your own trend over time, measured consistently with the same methodology. External benchmarks from Gallup, SHRM, and other research organizations provide context, but your internal trajectory matters more than how you compare to an anonymous average. For a deeper understanding of what different scores mean in practice, see our guide to the levels of employee engagement.
What is the relationship between employee engagement and retention?
Engaged employees are significantly less likely to leave. Gallup's research shows that business units with top-quartile engagement experience dramatically lower turnover compared to those in the bottom quartile. The relationship is strongest at the team level, because engagement is heavily influenced by direct manager behavior. Tracking both metrics together, and segmenting by manager, helps you predict turnover risk and target retention strategies before your best people leave. Use the employee turnover cost calculator to quantify what improving retention by even a few percentage points would save your organization annually.
Keep Reading


Like What You Hear?
We’d love to chat with you more about how HR Cloud®can support your business’s HR needs.
Book Your Free Demo